Metabolic Fate of Exogenous Chondroitin Sulfate in the Experimental Animal | Equine Clinical Research
Arzneim.-Forsch./Drug Res. 40 (1), Nr.3 (1990)
Reprinted with permission of publisher
Metabolic Fate of Exogenous Chondroitin Sulfate in the Experimental Animal
L. Palmieri, A. Conte, L. Giovannini, P. Lualdi, and G. Ronca
Summary
After the administration of tritiated chondroitin sulfate (CS) by oral and intramuscular route, the distribution of radioactivity was investigated in two opportunist omnivorous animals, namely the rat and the dog. More than 70 % of the orally administered radioactivity was absorbed. Independently of the administration route, radioactivity was mainly excreted through the urine. Plasma levels showed a rapid increase after oral administration, followed by a large plateau with a maximum at the 14th and 28th h in the rat and in the dog, respectively. A tropism of the radioactivity was observed towards glycosaminoglycan-rich tissues, such as joint cartilage. The analysis of the molecular weight of the radioactive material showed that compounds with a molecular weight corresponding to those of CS, poly-, oligo- and monosaccharides as well as of tritiated water, were present in the plasma, urine, synovial fluid and cartilage. The level of radioactive low molecular weight material, derived from the metabolism of CS and from the exchange reaction, increased with the time after administration. The high molecular weight fraction represented at least 10% of the orally administered CS.1. Introduction
The pharmacological interest in glycosaminoglycans (GAGs) has markedly increased with the knowledge of their biological role. In addition to the anticoagulant effect of heparin and the clarifying action of heparin and heparinoids, some other functions are now recognized, such as the chondroprotection of chondroitin sulfates [1], the vasoprotection of heparan sulfate [2], and the use of hyaluronic acid in microsurgery [3]. The synthesis of proteoglycans and hyaluronate has been clarified, whilst their breakdown and the regulation of their turnover, in normal and pathological conditions, are less known.The metabolism of exogenous GAGs, both orally and parenterally administered, is also not well known, though this knowledge would be particularly useful in view of their therapeutic applications.
In this paper, we report the results of investigations on the metabolic fate of tritiated chondroitin sulfate administered to rats and dogs, two species of opportunist omnivorous animals; similar to man.
2. Material and methods
2.1. AnimalsWistar rats (210-260 g) and young beagle dogs (4-6 kg) of both sexes were used. The animals were kept fasting overnight. Fasting animals had free access to tap water, but food was withheld up to 4 h after labeled compound administration. All the animals were housed in metabolic cages to collect urine and feces separately.
2.2. Substance
The chondroitin sulfate (CS) used in this experimental work was a mixture of chondroitin-4-sulfate (50%) and chondroitin-6-sulfate (50%) with an average molecular weight of 14,000 daltons, an SO3H/COOH ratio near to 1, devoid of anticoagulant activity.
2.3. Labeling procedure
3H-chondroitin sulfate (3H-CS) was prepared by reduction with sodium 3H-borohydride. This technique does not markedly alter GAG structure [2]. After the treatment, borohydride excess was removed by gel filtration on a Sephadex G-100 column. 3H-CS had a specific activity of 12.5 mCi/mg and was devoid of low molecular weight radioactivity.
2.4. Experimental protocol
3H-CS, conveniently added to non-labeled CS and dissolved in saline, was administered to rats either orally or intramuscularly at a single dose of 16 mg/kg and 90 FCi/kg. Venous blood, urine, and feces were collected at intervals after administration. Rats were sacrificed at different times and the main organs were taken and stored at -80EC until analysis. The labeled compound was also given to four dogs at the dose of 16 mg/kg and 22 FCi/kg. Blood, urine, and feces were collected at intervals. The administration to dogs was only oral through a meat bolus. Synovial fluid was also collected from dogs after carrageenin injection into the front limb joint.
2.5. Radiochemical and analytical methods
The radioactivity in the collected samples was measured in a liquid scintillation counter with quenching correction. Plasma, urine and synovial fluid radioactivity was determined directly. Homogenates of liver, kidney, lung, brain, adipose tissue and feces were made in saline containing 0.1% Triton X-100. After centrifugation, the supernatants were counted for radioactivity. The fibrous tissues were homogenized in saline and treated with papain according to Blumenkrantz et al. [4]. At the end of incubation, 0.1 % Triton X- 100 was added and after centrifugation radioactivity was measured.
Samples of plasma, urine, synovial fluid, and cartilage extract were chromatographed on an Ultrogel AcA 44 column (70 x 2.5 cm) equilibrated with 0.2 mol/l NaCl in 10 mmol/l phosphate buffer pH 7. Radioactivity was measured in eluate fractions. CS and N-acetylgalactosamine were used as reference molecular weights. In some cases, before chromatography, the samples were freeze-dried to remove volatile radioactivity (tritiated water).
2.6. Calculation of pharmacokinetic parameters
Pharmacokinetic analysis of the plasma level time curves of 3H-CS were performed using the iterative curve fit programme [5]. Peak concentrations and peak times were determined by interpolation of the data. AUCs from zero to time "t" were calculated using the trapezoidal rule. To calculate CS concentration in plasma and in the synovial fluid, "total radioactivity"/ml was used, independently of the nature of the radioactive compounds which could have been present. The depolymerization of CS, the exchange of tritium and the metabolization of carbohydrate molecules result in the formation of tritiated water and radioactive mono- and oligosaccharides.
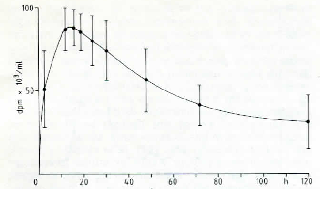 |
| Fig. 1: Plasma levels of radioactivity after oral administration of tritiated CS. |
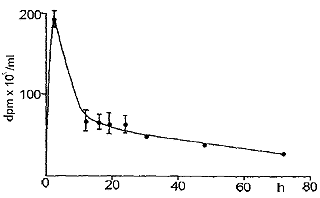 |
| Fig. 2: Plasma levels of radioactivity in the rat after intramuscular injection of tritiated CS. |
3. Results
3.1. Distribution of radioactivityTables 1 and 2 report the percentage of the administered radioactivity found in rat urine, feces and organs. When 3H-CS was given orally, more than 70 % of the radioactivity was absorbed and found in urine and tissues. Urine was the main route of excretion. When 3H-CS was injected intramuscularly, the urinary excretion was higher, whilst the same radioactivity percentage was found in tissues. In the dog, too, absorption was more than 70 % of the orally given radioactivity, and urine was the main route of excretion (Table 3).
Fig. 1 reports the plasma levels of radioactivity in rats after oral administration. It may be observed that radioactivity rapidly rises, and already after 150 min it is about 60 % of the peak value. A similar result was obtained in the dog (Fig. 2). Successively, in both species, a slow increase of radioactivity was observed; the peak value was reached after 14 h in the rat and after 28 h in the dog. Actually, the course can be better described as a plateau between the 6th and the 30th h in the rat, and between the 6th and the 40th h in the dog, rather than a sharp peak. Then, radioactivity slowly decreased. When 3H-CS was given intramuscularly to the rat, a high peak of radioactivity was observed already within the first hours; then, there was a rapid decrease which reached a plateau between the 10th and the 30th h (Fig. 3). The plasma radioactivity peak coincided with the highest value of urinary excretion. Table 4 shows the pharmacokinetic parameters obtained from plasma radioactivity levels. Table 5 reports the distribution of radioactivity in some tissues after oral and intramuscular administration to rats. Radioactivity was high not only in the liver and kidneys, organs involved in the breakdown and in the excretion of oligo- and polysaccharides, but also in cartilages where the compounds tend to accumulate. Radioactivity 24 h after oral and intramuscular administration was higher in the intestine and kidneys, respectively, as compared to other tissues. In the synovial fluid of the dog (Table 6), radioactivity was 66.5 % higher than in the plasma.
3.2. Molecular weights of the radioactive material
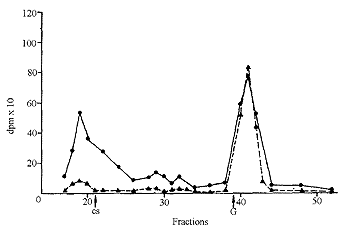
In urine, collected during the first hours after administration, an aliquot of radioactivity had a molecular weight corresponding to that of CS. Radioactive compounds with intermediate molecular weights, due to partial hydrolysis of CS, were present too (Fig. 4). A large peak with the molecular weight equal to or lower than that of one of the constituent monomers, N-acetylgalactosamine, was also observed. The radioactivity of the low molecular weight material progressively increased with the time after administration and, after 24 h, it represented most of the radioactivity.
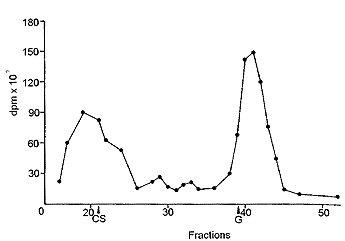
In plasma and in synovial fluid (Fig. 5 and 6), molecular weights higher than that of the administered CS were found, probably due to the binding of CS or of its derivatives to proteins. In fact it has been observed that, in plasma, CS is associated with proteins [6]. In plasma too, the low molecular weight material increased with the time after administration. A part of the radioactive low molecular weight material found in urine and in plasma, as well as in tissues, was volatile and was removed by lyophilization. This was the aliquot which increased with the time after administration.
The chromatography of the extract of rat joint cartilage after papain digestion and lyophilization is shown in Fig. 7. Compounds with high molecular weight were present, while radioactivity was low in the fractions corresponding to the molecular weights of CS monomers and tritiated water.
3.3 General and local toxicity
The compound was well tolerated. After administration, no change was observed in clinical signs, and examination of individual animals did not show any symptom of local and general toxicity.
| Table 1: Distribution of radioactivity after oral administration of 3H-CS to the rat. | |||
| % of administered radioactivityHours after administration | |||
| 24 | 48 | 72 | |
| Urine | 12.8 " 3.8 | 17.8 " 3.6 | 21.6 " 2.4 |
| Feces | 23.8 " 3.0 | 26.4 " 1.0 | 26.6 " 2.6 |
| Tissue | 54.3 " 3.0 | 48.8 " 2.8 | 41.4 " 2.4 |
| Data are mean " S.D. of 10 animals. | |||
| Table 2: Distribution of radioactivity after intramuscular administration of 3H-CS to the rat. | |||
| % of administered radioactivity Hours after administration | |||
| 24 | 48 | 72 | |
| Urine | 49.8 " 3.5 | 56.1 " 4.0 | 58.9 " 5.1 |
| Feces | 1.4 " 0.4 | 2.7 " 0.7 | 3.2 " 0.6 |
| Tissue | 45.6 " 5.6 | 38.7 " 6.4 | 31.6 " 5.9 |
| Data are mean " S.D. of 6 animals. | |||
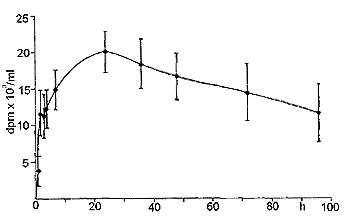 |
| Fig. 3: Plasma levels of radioactivity in the dog after oral administration of tritiated CS. |
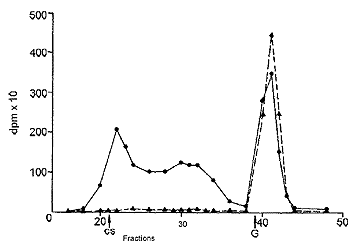 |
| Fig. 4: Gel filtration of dog urine 3 h (C) and 24 h (>) after oral administration of tritiated CS. CS, elution of chondroitin sulfate,G,elution of N-acetylgalactosamine. |
| Table 3: Distribution of radioactivity after oral administration of 3H-CS to the dog. | |||
| % of administered radioactivityHours after administration | |||
| 24 | 48 | 72 | |
| Urine | 7.0 " 1.9 | 9.9 " 1.5 | 11.2 " 1.6 |
| Feces | 6.2 " 1.4 | 14.0 " 2.1 | 14.8 " 1.3 |
| Data are mean " S.D. of 4 animals. | |||
| Table 4: Pharmacokinetic parameters calculated from plasma radioactivity. | |||
| Peak Time (H) | Peak Concen- tration (Fg/ml) | AUC (Fg/ml) | |
| Rat/ oral administration | 14.1"5.8 | 7.1"1.2 | 463.6"122.3 |
| Rat/ intramuscular injection | 2.5 (estimated) | 15.7"0.8 | 403.4" 61.8 |
| Dog/ oral administration | 28.5 " 5.7 | 5.9 " 0.7 | 469.5 " 40.0 |
| Data are mean " S.D. of the number of animals reported in Table 1, 2 and 3, respectively. | |||
| Table 5: Distribution of radioactivity in some tissues after oral and intramuscular administration of 3H-CS to the rat. | ||||
| 24h | 24h | 72h | 72h | |
| Tissues | Oral administration | Intramuscular administration | Oral administration | Intramuscular administration |
| dmp/g tissue | dmp/g tissue | dmp/g tissue | dmp/g tissue | |
| Small intestine | 166,400 | -- | 81,000 | -- |
| Liver | 162,700 | 318,400 | 73,900 | 43,300 |
| Kidney | 14,900 | 897,000 | 86,800 | 65,800 |
| Lung | 99,700 | 79,700 | 69,700 | 43,600 |
| Brain | 31,000 | 39,200 | 39,400 | 40,600 |
| Muscle | 110,600 | 85,100 | 83,200 | 51,200 |
| Eye | 92,900 | 75,800 | 111,900 | 81,300 |
| Trachia | 104,100 | 91,000 | 100,700 | 84,800 |
| Joint cartilage | 103,000 | 94,400 | 127,800 | 92,000 |
| Adipose tissue | 27,100 | 40,100 | 40,100 | 32,400 |
4. Discussion
The studies of Wood et al. [7] demonstrate that labelled CS, intravenously administered to the rat, is in part rapidly lost through urine after partial desulfation and depolymerization. A part of the radioactivity remains in the body. Our results obtained after the intramuscular administration of CS largely correspond to those of Wood et al. [7]: CS rapidly enters the blood and a large aliquot is rapidly lost in urine.More debated are the results obtained by several authors after the oral administration of GAGs. Some describe a marked absorption of GAGs [1, 2, 8-12], some, on the other hand, observed no or only negligible absorption [13-15]. Some differences found by the various authors can probably be ascribed to the animal species and/or to the method for the determination of the absorbed material. Generally, when GAGs with high sulfation degree labelled in the sulfate group are used, the absorption has been found to be negligible. On the other hand, it is well known that the anticoagulant activity of heparin, the most sulfated GAG, is lost when it is orally administered. The behavior of the compounds characterized by a lower sulfation degree, such as chondroitin sulfate, dermatan sulfate and heparan sulfate, is different and more consistent absorption levels are obtained [1, 2, 8-12].
 |
| Fig. 5: Gel filtration of dog plasma 3 h (C) and 24 h (>) after oral administration of tritiated CS. CS, elution of chondroitin sulfate, G, elution of N-acetylgalactosamine. |
 |
| Fig. 6: Gel filtration of dog synovial fluid 5 h after administration of tritiated CS. CS, elution of chondroitin sulfate, G, elution of N-acetylgalactosamine. |
| Table 6: CS concentration calculated from radioactivity in dog plasma and synovial fluid from front limb joint. | |
| Fg/ml | |
| Synovial fluid | 6.0"0.9 |
| Plasma | 10.1" 2.2 |
| Data are mean " S.D. of 3 animals | |
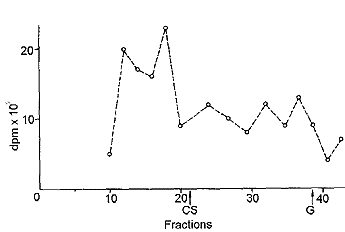 |
| Fig. 7: Gel filtration of rat joint cartilage extract 24 h after oral administration of tritiated CS. CS, elution of chondroitin sulfate, G, elution of N-acetylgalactosamine. |
We have observed a high absorption of radioactivity when tritiated CS is orally given to the rat and the dog. In fact, if we consider the total radioactivity present in plasma, urine and tissues, more than 70 % of the orally administered radioactivity appears to be absorbed. However, analysis shows that the radioactive material present in physiological fluids is heterogeneous with respect to molecular weight. CS, poly- and oligosaccharides, monomers derived from the breakdown of tritiated CS, are present together with tritiated water due to the exchange reaction and/or to CS metabolization. The amount of tritiated water increases with the time after administration. The exchange reaction and the metabolization of CS are responsible for the complexity of the plasma radioactivity curve when CS is orally administered.
The broad peak, which appears several hours after oral administration with a shoulder in the first hours, suggests a rapid absorption of a part of the administered compound followed by the diffusion of radioactivity. This is confirmed by the analysis of the molecular weights of the radioactive material. The time peak and the peak concentration represent an integral value of different tritiated compounds (CS, oligo- and polysaccharides, monomers, water, newly synthesized compounds, etc), the concentration of which varies with the time after administration.
It is not easy to measure the amount of the absorbed products with higher molecular weight; but, on the basis of their plasma levels and urinary excretion, we estimate that they represent about 10 % of the administered dose, that is 15 % of the absorbed radioactivity. This value is similar to the bioavailability of other GAGs with low sulfation degree, such as dermatan sulfate and heparan sulfate [2, 12]. It is very likely that the estimate is defective, since an aliquot of the absorbed material with high molecular weight had lost its radioactivity and so was no longer detectable. In addition to the compounds with high molecular weights, monomers and disaccharide units are absorbed, increasing the amount of the CS derivatives which are absorbed through the intestinal route. Different mechanisms may be taken into account to explain the absorption of high molecular weight material after oral CS administration. Sue [10] reports the absorption of heparin activity by the isolated rat stomach, indicating that some high molecular weight material may enter the blood.through this route. Another possible mechanism is the pinocytosis of the intestinal mucosa. Recently, Dawes et al. [12] have observed that the absorption of dermatan sulfate increases when the compound is given during the meal. To explain this observation, we may take into account the possibility that an "overflow" of high molecular weight material saturates the lysosomial hydrolytic activities, and that some of the undigested material flows into the blood.
5. References
[1] Gross, D., Therapiewoche 33, 4238 (1983)-- [2] Segre, G., -Min. Med. 77, 1859 (1986)-- [3] Rastrelli, A., Calderina, G., Cosmesi Dermatol. 22, 58 (1988)--[4] Blumenkrantz, N., Asboe-Hansen, G.,.Meth. Biochem. Anal. 24, 39 (1977) -- (5] Leferink, J., Maes, R., Arzneim.-Forsch./Drug Res. 28(II), 1894 (1979)-- [6] Lindhal, U:, Hook, M.; Ann. Rev. Biochem. 47, 385 (1978)--[7] Wood, K.M:, Curtis, C. G., Powell, G.M., Wusteman, E.S., Biochem. J. 158, 39(1976)--[8] Pescador, R., Diamantini, G., Mantovani, M., Malandrino, S., Riva, A., Casu, B:, Oreste, P., Arzneim.-Forsch./Drug Res, 30(II), 1893 (1980)-- [9] Clevidence, B. A., Failla, M. L., Vercellotii, I. R., Pescador, R., Arzneim.-Forsch./Drug Res. 33, 228 (1983)-- [10] Sue, T. K.; in: Heparin: Structure, Cellular Functions and Clinical Applications, N. M. Mc Duffie (ed.), p.159, Academic press. NewYork (1979)--[11]Orzalesi, R., Fulignati, A., Marinelli, R., Rosati, E., Branchi, R.,Gazz. Med. Ital. 140, 577(1981)--[12] Dawes. J., Hodson, B. A., McGregor, I. R., Pepper, D. S., Prowse. C. V., Ann. N. Y. Acad. Sci. 556, 292 (1989)--[13]Konador. A., Kawiak, J., Folia.Biol. 24, 177(1976)--[14] Konador, A., Kawiak, J., Arch. Immun. Ther. Exp. 25, 895 (1977)-- [15] Chasseaud, L. F., Fry, B. J., Saggers, V. H., Sword, I. P., Hathway, D. E., Biochem. Pharmacol. 21, 3121(1972)